Why Profitability Analysis Matters in Injection Molding
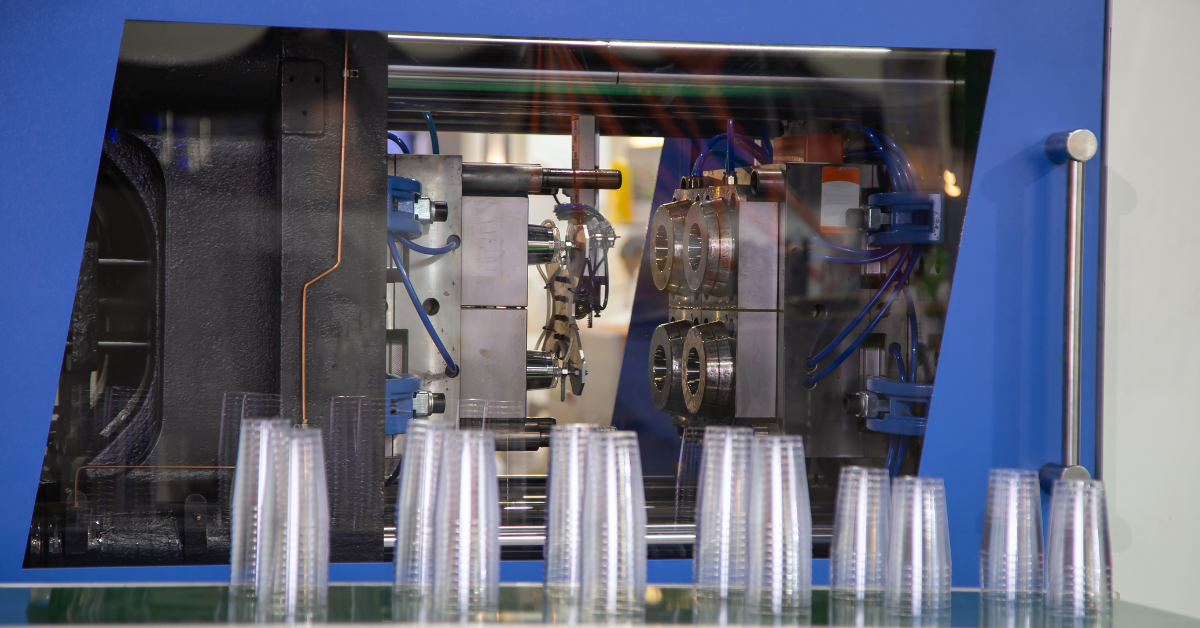
Plastic injection molding drives production for everything from automotive components to consumer electronics. With global competition and razor-thin margins, knowing exactly where your money goes—and where it's wasted—separates profitable shops from those struggling to break even.
Here's the reality: most manufacturers don't know their true part costs. They guess. They use outdated spreadsheets. They accept whatever margin they can get without understanding why their neighbor's $0.45 part beats their $0.52 cost.
This guide introduces a proven framework used by manufacturers making 15-22% margins instead of 3-5%.
💡 Key Insight
The difference between a profitable injection molding operation and a struggling one often comes down to one thing: how well you track and optimize the seven core cost drivers. Get these right, and you can confidently quote jobs, negotiate contracts, and grow.
The 7-Pillar Profitability Framework
Instead of treating profitability as a mystery, break it into seven measurable pillars. Each one directly impacts your bottom line. Together, they tell you exactly what's working and what needs fixing.
| Pillar | What It Covers | Impact on Profit |
|---|---|---|
| Material Costs | Raw resin + colorants + scrap factor | 30-45% of part cost |
| Cycle Time | Seconds per part → machine utilization | 20-30% of part cost |
| Machine Rate | Equipment cost + energy + depreciation | 15-25% of part cost |
| Labor | Operator wages, benefits, training | 8-15% of part cost |
| Tooling Amortization | Mold cost spread across production volume | 2-10% of part cost* |
| Overhead | Rent, utilities, admin, insurance | 5-15% of part cost |
| Scrap & Waste | Defects, rework, setup waste | 1-8% of part cost |
*Higher impact early in production runs; decreases as volume increases
Real-World Case Study: 100,000 Unit Order
Let's walk through a real calculation. This example shows exactly how the framework works when you're actually quoting a job.
The Scenario
A medium-sized shop receives an order for 100,000 plastic pump housings from a home appliance manufacturer.
- Part weight: 120 grams
- Material: standard polypropylene @ $2.00/kg
- Scrap rate: 4%
- Cycle time: 30 seconds
- Mold cost: $40,000
- Customer quote: $0.95 per part
The Calculation (Step by Step)
The Results
| Cost Component | Per Part | % of Total |
|---|---|---|
| Material | $0.25 | 27% |
| Machine/Energy | $0.33 | 35% |
| Labor | $0.10 | 11% |
| Tooling Amortization | $0.10 | 11% |
| Overhead Allocation | $0.15 | 16% |
| Total Cost | $0.93 | 100% |
📊 The Profit Picture
Selling Price: $0.95 | Total Cost: $0.93 | Profit per part: $0.02
Total profit on 100,000 units: $2,000 (2% margin)
This is real. This is what competition looks like. And this is why the next section matters.
3 Ways to Boost Profitability (Without Lowballing Customers)
1. Shave Cycle Time by 5 Seconds
Reducing cycle time from 30 to 25 seconds increases output by 16%. Over 100,000 units, this saves $2,777 in machine costs—more than doubling your profit on this order.
How: Optimize cooling channels, reduce pack/hold time, improve mold flow with simulation.
2. Negotiate Material Cost Down 5%
Saving $0.02 per kilogram × 0.1248 kg per part = $0.002 savings per part. Over 100,000 units = $200 additional profit.
How: Get quotes from 3-5 resin suppliers, consolidate orders, ask about recycled-content compounds.
3. Improve First-Pass Yield to 98%
Reducing scrap from 4% to 2% cuts material waste in half—saving $0.05 per part across the run.
How: Invest in real-time monitoring, standardize procedures, implement moldflow analysis before production.
💰 The Real Impact
Implement all three improvements, and that $2,000 order becomes $5,500+ profit. That's the difference between barely staying open and scaling aggressively.